Data Analysis

Carbon Capture Analysis

Carbon Capture Dashboard Analysis shows valuable insights into emission trends, capture efficiency, and overall environmental performance. The dashboard visualizes real-time data to help organizations monitor carbon reduction progress, identify improvement areas, and make strategic, data-driven decisions for sustainable growth.

Pharmaceutical Sales Dashboard

The Pharmaceutical Sales Dashboard showcases real time insights into product performance, revenue growth, and profitability across regions. It helps identify sales trends, evaluate top performing segments, and support data driven decisions for improved business outcomes.

PAF-KIET University Dashboard

The PAF-KIET University Dashboard serves as a powerful analytical tool that enables the university to effectively monitor student data, manage fee collections, and evaluate departmental performance. By presenting key insights such as total fees, outstanding payments, program-wise enrollment, and student distribution across regions, it provides a comprehensive overview of the institution’s financial and academic landscape. 

Supply Chain Analysis

Supply Chain Analytics focuses on transforming raw operational data into actionable insights that enhance efficiency, reduce costs, and improve decision-making across the supply chain. By leveraging data visualization, predictive models, and performance metrics, it helps organizations monitor every stage from procurement and inventory management to logistics and delivery.

Google Ads Dashoard

Google Ads Performance Dashboard  turning campaign data into smart insights.
From clicks to conversions, every metric is visualized to support faster and better ad optimization.
This dashboard highlights keyword performance, cost trends, audience engagement, and ROI, helping identify what truly drives results.

AMAZON POJECTS

Ultra Sonic Cleaner Dashboard

This Ultrasonic Retainer Cleaner Dashboard provides a complete view of monthly sales, revenue, profit, ROI, and break-even units.
It highlights performance trends across months, helping identify growth patterns and financial insights at a glance.

Toddler Carrier Feasibility

A comprehensive dashboard showcasing key financial indicators including monthly revenue, profit growth, ROI, and variable costs.
It highlights performance patterns and helps determine the feasibility and long-term viability of the toddler carrier product.

Bean Bag Feasibility

A complete feasibility analysis for the Bean Bag product, showcasing monthly revenue patterns, profit trends, ROI, and variable costs.
This dashboard supports strategic decision-making and helps determine the potential profitability of the product.

Knee Brace Feasibility

This Knee Braces Feasibility Dashboard delivers a sophisticated analysis of revenue dynamics, profitability trends, ROI performance, and break-even thresholds.
It provides a strategic lens to evaluate product viability, operational efficiency, and long-term market potential.

Tallow Cream Feasibility

A comprehensive visualization of key financial metrics, this dashboard analyzes sales trends, variable costs, and profit behavior for tallow cream.
It enables informed decision-making by highlighting economic feasibility and growth potential with clarity.

Thyroid Support Drops

A data-driven visualization of key performance indicators, this dashboard examines sales behavior, cost dynamics, and profit efficiency for thyroid support drops.
It supports informed decision-making by revealing the product’s economic feasibility and growth trajectory.

Water Bottle Feasibility

A detailed visualization of financial metrics, this dashboard evaluates sales dynamics, variable costs, and break-even thresholds for water bottles.
It empowers data-driven decision-making by highlighting economic feasibility and growth potential.

Keyword Analytics Dasboard

Keyword Metrics & Trend Analysis

This Power BI dashboard analyzes “Web Developer” keywords, quantifying market demand (209K monthly searches) and competition intensity (8573 index value). It visualizes top-of-page bid ranges and segments related terms, providing actionable insights for SEO and PPC strategy.

Meta Compaign

Facbook Ad Draft

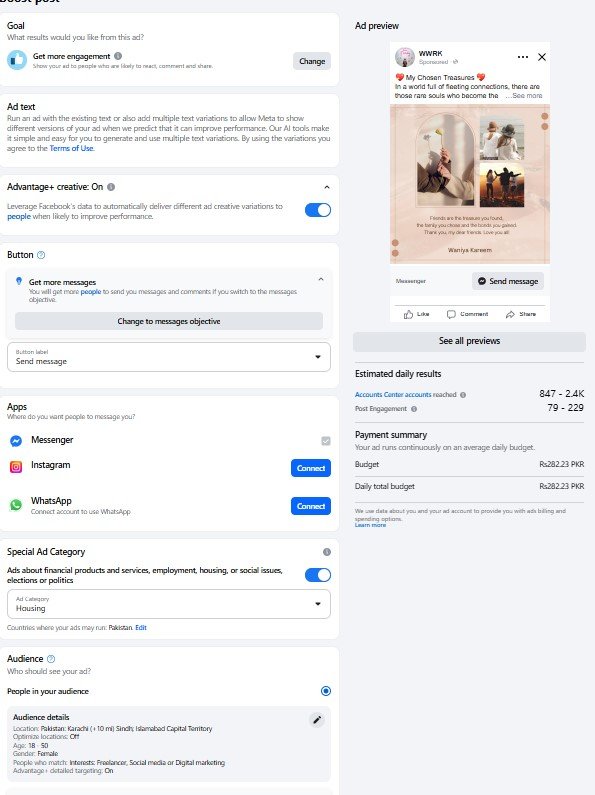
The ad uses a beautiful, aesthetic image and a strong, emotional message about friendship and “chosen family”.

Objective: The current goal is “Get more engagement”.

Budget: Rs 282.23 PKR (ad runs continuously on an average daily budget).

Post Engagement: 79 – 229

Audience Targeting:

  • Location: Karachi (+10 mi) Sindh, Islamabad Capital Territory, Pakistan.

  • Gender: Female.

  • Age: 18-35